 Supa
SupaBeast: A 24/7 Database Performance Engineer for Supabase
At my previous company, my job on the team was to make sure the features we shipped stayed fast in production as the product grew. I spent a lot of time in Postgres query plans, looking at indexes and tracing how the application used the database.
Engineers are now using coding agents to ship features much faster than they could build them by hand. The team still needs someone looking at what that code does in production, finding bottlenecks, and working out which parts of the backend need to change.
Tools like CodeRabbit and Greptile automate code reviews with context from across the repository. Greptile's TREX also runs targeted tests in a sandbox. Those checks can catch bugs and suspicious database code before it merges.
A source-only review can flag suspicious SQL, but it can miss how that SQL behaves against real production data. These are the kinds of problems a database performance engineer looks for:
- Joins that multiply intermediate rows. A query joins an account to its invoices and payments before grouping the result back to one row per account. With 100 invoices and 200 payments for that account, those joins can produce 20,000 intermediate rows to return a single account.
- Unbounded reads behind a small result. A dashboard query calculates totals for every customer, sorts by total, and applies
LIMIT 20. The page shows twenty rows, but the database still has to read all the orders that contribute to those totals. - Indexes that stop helping a query. An index on
statuscan work well when the value you're filtering for matches a small fraction of the table. As that status becomes common in production, Postgres may correctly choose a sequential scan instead. The index still exists, but the data has changed how useful it is. - Permission checks repeated for every row. A permission lookup can be cheap when called once, but an RLS policy can run it for every candidate row. A query that looks fine with a handful of test records can spend most of its time repeating that check for a large customer's data.
A small sandbox dataset can make all of these look inexpensive. To see where the work is going, you need query plans, row counts, and execution statistics from the database your users are actually using. You also need to know how often the application runs each query, because a small cost repeated across a busy workload can become a bottleneck.
That's what we're building with SupaBeast: a 24/7 database performance engineer for Supabase. It connects the code being written to what's happening in the production database, so performance gets attention while the team keeps shipping features.
Agents play it safe by adding code instead of refactoring
This often starts with an ordinary feature request. A sales dashboard already lists the people on a team, and a manager wants to see how many calls each person completed this week. You ask the coding agent to add that count next to each name.
The dashboard gets its list of reps from a database view, so the agent adds a weekly call count to that view. It checks that each count is correct and that managers can only see their own team's records. The pull request passes review.
What gets less attention is whether that view should calculate those counts every time someone opens the page. Other pages may use the same view and end up calculating call counts they don't even display. Finding that out requires following the code beyond the feature you asked for.
The existing code encourages the agent to keep going in the same direction. Other functions use the view. Tests depend on its behavior. Your instructions tell the agent to reuse existing code and avoid unrelated changes. Adding the feature fits those instructions. Replacing the view means taking on a much larger task.
Martin Fowler and Unmesh Joshi describe these as two different parts of programming: using a design you've already worked out, and working out what the design should be. Agents can help with both. The second takes an ongoing conversation about alternatives, rather than another request to add something.
Researchers studying experienced developers found a similar pattern. Developers supplied project context, wrote rules, and supervised the agents to get the quality they needed. They reported good results with straightforward, repetitive work, and more difficulty with complex changes and existing systems. Performance under heavy load was one of the problems they called out. The engineering knowledge was still coming from the person directing the agent.
Tests pass when they check the wrong thing
A test can confirm that a query returns the right 40 records without checking whether the database examined 300,000 records to find them. Updating one call can produce the correct result while also recalculating thousands of unrelated applications. A background job can correctly report that there's nothing to process after spending hundreds of milliseconds finding that out.
Those problems need tests that check how much work the database does, as well as what it returns.
Adding another reviewer won't help much if both agents use the same small test database and check the same expected result. A handful of recent calls from one user won't reveal what happens after months of calls from several agencies. The test data needs calls that have already been processed, older records, and users with different access permissions. Then you need to check which records the query reads and which ones it changes.
The database wizard still has a job
Keeping a backend fast is a whole job. You'll find it under titles like database performance engineer or database reliability engineer. GitLab's database reliability role includes query and schema optimization, application tuning, and architectural changes to handle growth.
Database consultant Craig S. Mullins describes the cleanup in his column on AI-generated SQL. An application passes functional tests, gets deployed, and slows down. Then someone calls the DBA. AI makes it possible to produce SQL faster, which means the review and tuning work has to keep up. He argues for automated SQL checks during development, with database specialists concentrating on architecture and difficult performance problems.
My job at my previous company was to figure out where a request was spending its time and what needed to change. A page that makes dozens of database requests pays for every network round trip, even if each query uses an index. Sometimes the useful change is to combine those requests or stop repeating a calculation. I had to make those decisions with the rest of the application in mind, including how a change would affect other features using the same tables and functions.
Lukas Fittl at pganalyze makes a related argument in The Dilemma of the AI DBA. He sees useful work for agents in gathering production evidence, finding the code that produced a query, and reviewing PRs for bad patterns. His goal is to make engineers and database teams more effective while keeping their expertise involved in the decisions.
If you make a living fixing slow databases, a flood of AI-generated code can look like a healthy backlog. It's easy to see the job-security joke: someone will eventually get paid to clean it all up. For the team building the product, though, that cleanup arrives alongside slow pages, stalled features, and code that's become difficult to change.
Three examples from one backend
We investigated these problems at an insurance-sales company building CRM, calling, reporting, maps, and call reviews on Supabase. As the product grew, more features relied on the same tables and database functions.
The application already had tests for difficult cases, including conflicting records and users trying to access another agency's data. We used coding agents to find and fix expensive database work that those tests hadn't caught.
These results come from local benchmarks using the same test data before and after each change.
Updating one call recalculated thousands of applications
The database automatically recalculated call-to-application links after a call changed. It checked every application, even when only two were related to that call. The recalculation ran near the end of the transaction, so the request still had to wait for it to finish.
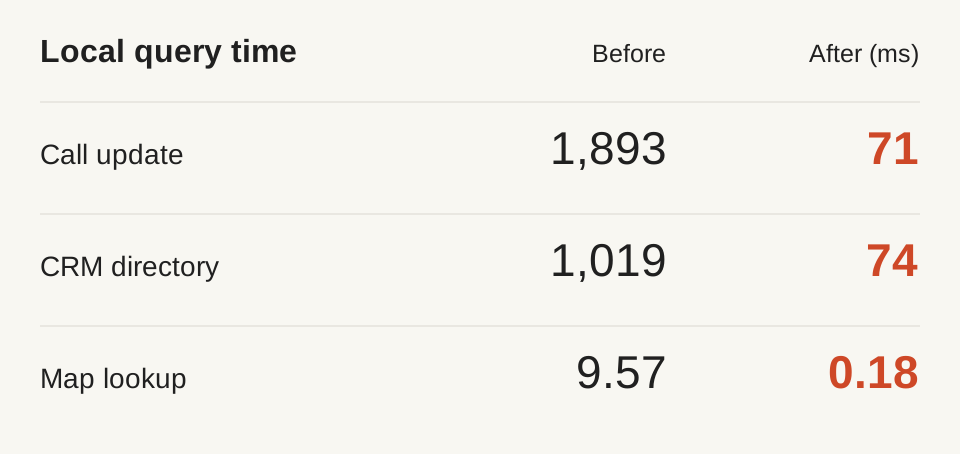
We changed the function to track which records had changed and recalculate only the applications they could affect. With 10,002 synthetic applications, the median call update fell from 1,893 to 71 ms. Both versions used the same schema and indexes. A regression test now adds unrelated applications and checks that updating the call leaves them alone.
The directory kept repeating permission checks
The CRM directory loaded a page of leads, counted matching leads, and calculated summaries. Those queries repeatedly looked up who the user was and which records they could access.
We looked up the user's identity once per SQL statement and reused the list of leads they were allowed to see. With 180 leads across two agencies, the manager's median SQL execution time fell from 1,019 to 74 ms for the combined page, count, and summary queries. Tests still checked that removing or changing someone's access took effect. This was already expensive with fewer than 200 leads.
The map searched other agencies' records
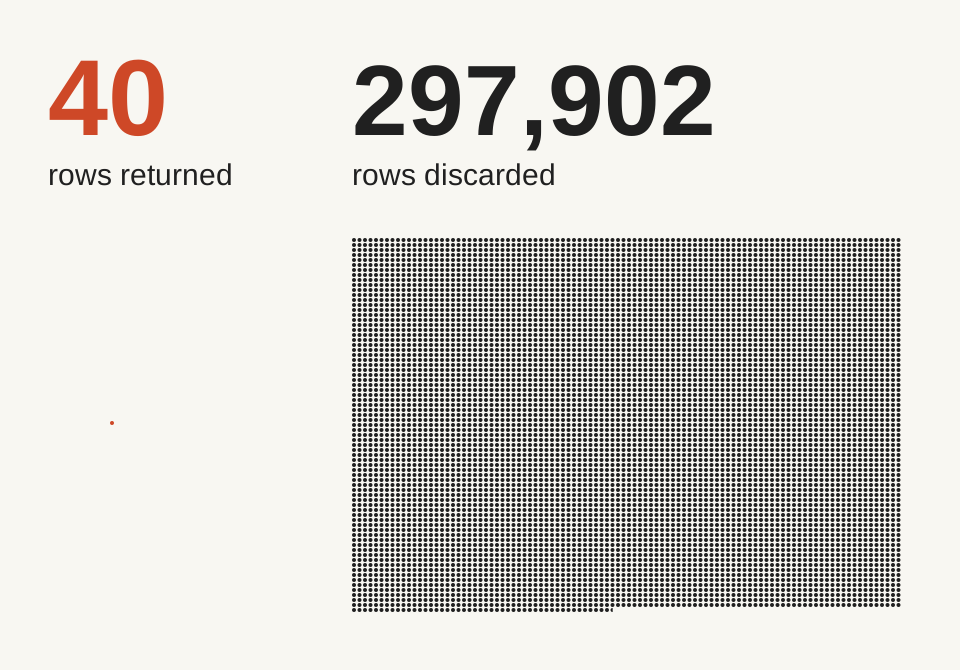
The map query used a spatial index to find records in the visible area. It then discarded records the caller's agency couldn't use. One hosted query returned 40 records after filtering out 297,902.
We added agency to the partial spatial index so Postgres could narrow the search earlier. In a separate local test with 298,067 synthetic records, median SQL time fell from 9.57 to 0.18 ms across ten runs with the database cache warmed up. The original query had an index; that index wasn't narrowing the search enough.
A database performance engineer that keeps looking
We're building SupaBeast to do this work continuously for teams developing on Supabase. Your coding agents can keep shipping features while a database performance engineer keeps checking what those features cost to run against your real data.
Much of the evidence is already available in Supabase. Its Metrics API exposes Postgres performance and health metrics, including CPU, I/O, and connections. Unified Logs, which entered open beta in July, brings logs from the project's services into one searchable view. September's Health Check Advisors surface sustained service error rates through the dashboard and Management API.
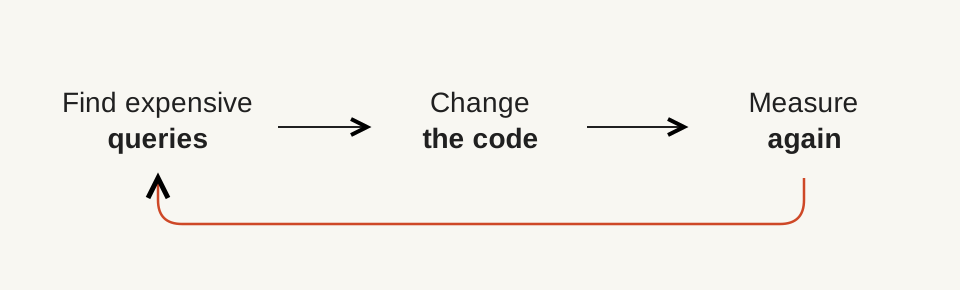
What we're building with SupaBeast takes that investigation into the repository: reviewing PRs against production evidence, finding the code responsible for expensive queries, and preparing fixes with regression tests and matched before-and-after measurements. We want teams to get that as one ongoing workflow, without having to assemble and maintain the monitoring, code investigation, and validation themselves.
Ongoing checks will give it a reason to revisit code nobody has touched as tables grow and workloads change. When it finds a problem, the workflow will open an issue or prepare a fix PR with tests and before-and-after measurements of the same operation. Nobody should have to notice a slow page, work out where to start, and prompt an agent to investigate.
Shipping more features with AI makes this work more necessary. Every feature can add another query, another caller of a shared function, or another background job. Teams need someone keeping track of what all of that costs in production before fixing the backend becomes the next project. That's the job I used to do, and it's the job we're building SupaBeast to take on, 24/7. We're working on the first release now.
If you're shipping AI-written code to Supabase, join the SupaBeast waitlist.